Saturday, February 21, 2009

U-6 Year Over Year Delta of the Delta: Acceleration Slowing?


Context: this is the rate of change of the Year Over Year change in U-6 (unadjusted). The absolute number may go down from one monthe to the next but still represent an increase from the previous year...this approach avoids the seasonality issues but can be more than a little confusing when you start looking at the underlying time series. We may be seeing some flattening in the acceleration, which would be slightly encouraging in that the breathtaking rate of increase might at least subside. However, in the last recession the YoY U-6 continued to increase for another two years after that point (albeit, much more slowly). Here we are starting from a higher base rate for U-6 in absolute terms, ramping up much faster and will likely take longer to begin the reduction when that happy day finally arrives.


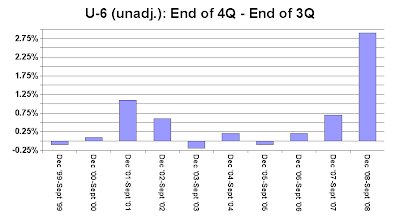
In the "it is different this time" department, I wondered how the end of year changes looked for the U-6 (unadj.) time series - how was the end of year holiday hiring? This graph looks at the change in U-6 (Dec 'XX - Sept 'XX) from 1999 to 2008. Grim.

U-6 - U-3 Spread Revisited


The spread between the U-6 unemployment rate and the 'headline' U-3 unemloyment rate continues to widen...I wish the U-6 series went back farther to have a larger dataset of how these rates behaved in more than the two recessions covered. But something sure seems to be different this time.

Saturday, January 10, 2009

Treasury Marketable Debt Maturity

Here are the December 31, 2008 numbers from the US Treasury on the maturity of outstanding marketable debt and an updated plot of the roll.

Here is the previous post on marketable Treasury maturity:
http://energyecon.blogspot.com/2008/11/worlds-biggest-arm.html

CIVPART - EMRATIO Revisited


It's been almost six months since I updated the CIVPART - EMRATIO spread, and nine months since the original post.
Events have completely borne out the local minima in this curve as a recession indicator, back in April 2008 when the question was still hotly debated ( the original post referred to above).
The original post:


Makes me go hmmmm....U6-U3 Spread (unadj.)


I was wondering about changes in the makeup of the labor force, and how the increase in contractors, temps and part-time might change how we view the headline (U3) unemployment rate, to wit "less is more." That is, incremental increases in the U3 unemployment rate might indicate larger negative impacts than they have in the past.
So I considered U-6, which casts the net much wider in considering unemployment, and far more of the "shadow unemployment." Which led me to the spread between the unadjusted U6 and U3 unemployment rates. Unfortunately, the time series I built is only ten years and captures one previous recession but the difference there is remarkable.

Saturday, December 6, 2008

Charge-off and Delinquency Rates from the Fed

Third quarter shows a slowing in the rate of acceleration of real estate loan charge-offs and delinquencies - again, this plot is looking at the rate of change of the rate of change - what was the delta in CHGDEL over the starting number (going from 4% to 5% is +25%, going from 5% to 4% is -20%). The total percent of loans going bad will be going up until this plot crosses the zero line.

So the rate of charge offs and delinquencies for RE loans is still more than doubling on a YoY basis, but the good news appears to be that the rate loans are going bad stopped accelerating...the question being, is this a real trend change or hiccup (as CRE appears to be really hitting the wall in 4Q2008, spending declines by consumers, more layoffs, etc.)?

U-6 Redux: Casting the Unemployment Rate net a bit wider


U-6 is one of the Bureau of Labor Statistics alternative measures of unemployment, and I think a better reflection of what is happening in a consumer driven economy at large than the headline unemployment rate (U-3 in BLS speak). The plot above is the year over year rate of change: if we went from 4% to 5% over the course of a year, that would be a 25% increase; if it went from 5% to 4% that would be a -20%.

Here is the definition for U-6:
Marginally attached workers are persons who currently are neither working nor looking for work but indicate that they want and are available for a job and have looked for work sometime in the recent past. Discouraged workers, a subset of the marginally attached, have given a job-market related reason for not looking currently for a job. Persons employed part time for economic reasons are those who want and are available for full-time work but have had to settle for a part-time schedule. For more information, see "BLS introduces new range of alternative unemployment measures," in the October 1995 issue of the Monthly Labor Review. Updated population controls are introduced annually with the release of January data.
I like to look at the second derivative as it were - the rate of change of the rate of change - so for the U-6 unemployment rate to actually go down, the plot above would have to go below zero. Looking at the 2001 recession, U-6 unemployment did not begin to decrease until the first quarter of 2004.


For the August post on U-6