Context: this is the rate of change of the Year Over Year change in U-6 (unadjusted). The absolute number may go down from one monthe to the next but still represent an increase from the previous year...this approach avoids the seasonality issues but can be more than a little confusing when you start looking at the underlying time series. We may be seeing some flattening in the acceleration, which would be slightly encouraging in that the breathtaking rate of increase might at least subside. However, in the last recession the YoY U-6 continued to increase for another two years after that point (albeit, much more slowly). Here we are starting from a higher base rate for U-6 in absolute terms, ramping up much faster and will likely take longer to begin the reduction when that happy day finally arrives.

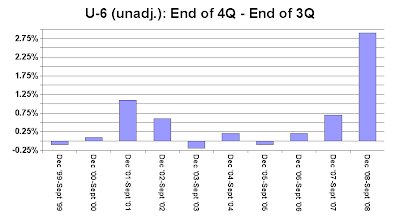
In the "it is different this time" department, I wondered how the end of year changes looked for the U-6 (unadj.) time series - how was the end of year holiday hiring? This graph looks at the change in U-6 (Dec 'XX - Sept 'XX) from 1999 to 2008. Grim.
