Wednesday, May 18, 2011

SLV % of Shares Outstanding Traded Daily Redux


First, we have about a 16 month view of the shares traded as a percent of outstanding...


Next, we are looking more closely at my SWAG at the region where the share volume appears to be 'different'...


Here we have the 10, 30 and 90 day daily moving averages of the share volume...


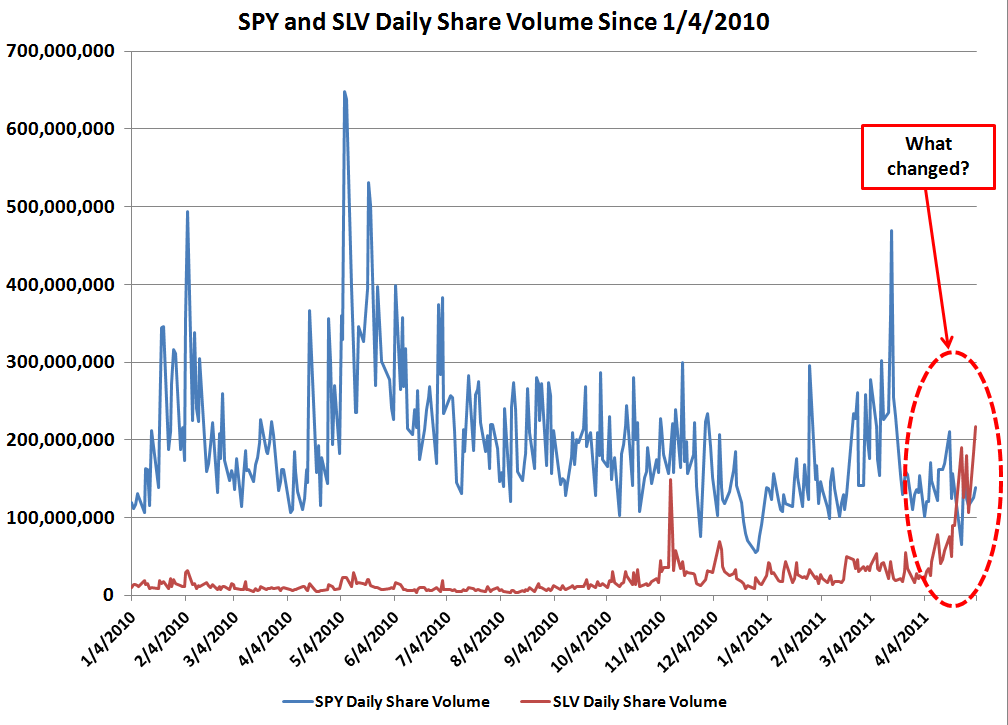
And finally, the comparison of SPY share volume to SLV share volume. Enjoy and a tip of the hat to Mike in Long Island of the CR commentariat for the shares outstanding data!

Wednesday, May 4, 2011

Tuesday, May 3, 2011

New Record in Daily Trading Volume for SLV


Another record set today in volume of shares traded and percent of outstanding shares traded in a single day.

Chart refresher, the right hand axis is shares outstanding (blue area and blue numbers on right axis), the left axis is percent of the outstanding shares traded on a particular day (red line and red numbers on left axis). The average line is the arithmetic average of all days for period covered (green), and the monthly MA line is a moving average of 22 trading days (orange).

Bon appetit.

Edit: adding a somewhat longer view of the same dataset where there appears to be a distinct change in the volume traded as the price ramp got underway in September, 2010.


Monday, May 2, 2011

Daily Trading Volume of SLV vs. Shares Outstanding Redux


Once more, and with a hat tip again to Mike in Long Island of the CR commentariat.