Wednesday, May 6, 2009

A/H1N1 Weekly Post 06 May 2009


Changing to a weekly view on this as it appears all of North America is in sustained community transmission mode. If this follows typical seasonal patterns it should start to trail off soon...otherwise, the peak new cases in the USA should occur around the end of June if the start was in the beginning of March (based on R0 of 1.6 and a world of other assumptions)

Hence the weekly view - here's hoping all the scoffers are correct - for this wave and in the Fall.


Image updated for Canada 06 May 2009 number (PHAC)


Adding link to unedited transcript of CDC presser today: http://tickerforum.org/cgi-ticker/akcs-www?post=94020

Adding link: WHO updated guidance on pandemic preparedness and response http://www.who.int/csr/disease/influenza/PIPGuidance09.pdf

Sunday, May 3, 2009

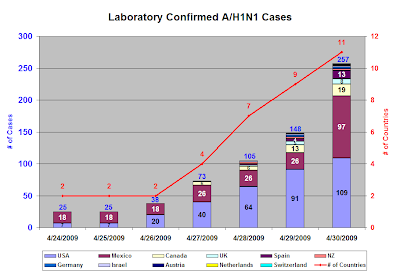
Lab Confirmed A/H1N1 Cases - update


Latest numbers gleaned from WHO, CDC, ECDC, PHAC...


Added link: ht to Market Ticker Forum unedited CDC transcript from this afternoon http://tickerforum.org/cgi-ticker/akcs-www?post=93578


Data request: Any curves similar to figure 2 in this ECDC paper - unfortunately this curve applies to the second wave of the 1918 influenza with an R0 of >3... need similar for R0=1.6 and R0=2.4 http://www.ecdc.europa.eu/en/files/pdf/Health_topics/Lessons_from_previous_pandemics.pdf

Great paper, hat tip Wisdom Speaker - translating the data from the log plots in this paper to the format from the ECDC paper is what I would truly like to see... http://www.pnas.org/content/103/15/5935.full.pdf+html

Saturday, May 2, 2009

Laboratory Confirmed A/H1N1 Cases - update


Already out of date from earlier this afternoon, country count is now 18, with South Korea added to the list...press reports 809 confirmed cases worldwide, with 197 in the USA.

Friday, May 1, 2009

Laboratory Confirmed A/H1N1 Cases - Update


Daily update, added some data sources beyond WHO as the update cycles are now hopelessly out of sync...huge spike in Mexico confirmed cases is likley a function of clearing out a testing backlog.


If you want to go directly to the data sources:

Wednesday, April 29, 2009

WHO Laboratory Confirmed A/H1N1 Cases


Well the World Health Organization just raised the Pandemic Alert Level to 5 from 4 (the raise to 4 was yesterday). Here is a graph of the laboratory confirmed cases of A/H1Na1, the flu previously known as "Swine."

Sunday, April 12, 2009

Treasury Marketable Debt Maturity Redux


UPDATE: the change in total marketable debt has been added (ht MrM)

Here is the end of 1Q2009 US Treasury marketable debt maturity plot - I have decided to update this quarterly - this makes the quarterly roll structure easiest to maintain and analyze.


  • It is still a front end loaded beast as it ever was, only more so...

  • The rate of growth for the next quarter roll doubles in six quarters (five to go!) if maintained at the 12.8% seen between the end of 4Q2008 and the end of 1Q2009

  • The rate of growth for the combined front two quarters roll shows a growth rate of 10.3%, which is weighted to the first quarter

The post showing the EOY 2008 maturity plot:


http://energyecon.blogspot.com/2009/01/treasury-marketable-debt-maturity.html