Tuesday, September 28, 2010
Alternate Misery Index
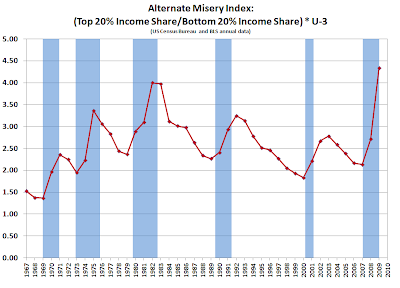
OK, so the commentariat over at Calculated Risk was kicking around conceps for an alternate misery index (or at least cinco-x and myself). If you will recall, the original misery index is the sum of the unemployment rate and the rate of inflation (Okun).
But in ZIRP world, inflation is not much of a factor even though misery we got aplenty, so what might be another approach to quantifying that? Above is one alternative, taking annual data from BLS for U-3 unemployment (well, that was monthly data taking an annual arithmetic average) and Census data for the ratio of the income share of the top 20% to the income share of the bottom 20% for the USA.
I think the 2010 numbers will be pretty close to the current set, so a conjecture for 2010 would be an approximately level line segment from 2009... though the most striking thing to me was the rate of change 2008-2009, I think the ripples are still propagating across the pond on that.
Friday, September 17, 2010
Household Formation and USA Population Changes
I'm still trying to figure out if this is just a descriptive statistics exercise or whether it may also inform on another level, but this is taking Census data for the number of households and the total population of the USA and looking at the ratio of the annual change in the number of households over the annual change in the population.
It is interesting to note that in some years, the number of households added exceeded the number of people added, so there are multiple factors in play... perhaps the most significant of which was the coming of age of boomer cohort members (with respect to the household formation rate). Any thoughts appreciated.
Friday, September 3, 2010
Decline in UEMPMED - Labor Market Deterioration?
So we saw a sharp decline in the median duration of unemployment with today's data release from the St. Louis Fed FRED database (mad propz to FRED!). Is this really an indication of improvements in the labor market in the USA?
Here we have the data series from FRED for the unemployed, segmented by duration. It is a bit busy, so what we are looking at here is the proportion of the 100% of the unemployed that each duration segment is contributing to that total...with the absolute number of each segment as the label for each month as well.
With respect to the longest term unemployed data segment, 27 Weeks and Over, is declining in both the absolute number and the relative contribution. On a month over month basis, the trend is also solidly in decline. But is the reason for this decline improvements in the labor market or workers exiting the labor force?
Looking at the change in PAYEMS, the total non-farm payroll in thousands of employees, the answer appears to be exit...
And finally, as a lagniappe for a negative interpretaion of the decline in UEMPMED, it appears that there was a big jump in the in the unemployed between 1-3 months, UEMP5TO14.
To recap on reasons for the decline in UEMPMED:
1. The longest term unemployed are declining according to the current counting methodology
2. They are almost certainly exiting the labor force as non-farm payrolls are flat over the period of the big declines in UEMPMED
3. A significant increase in the UE duration segment of between 1-3 months is also pulling the median down
Wednesday, August 11, 2010
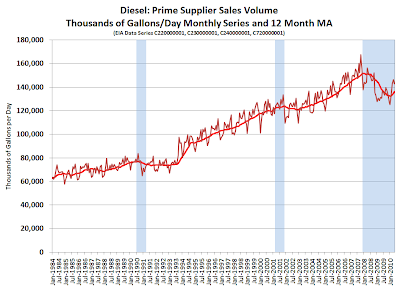
Diesel: US Prime Supplier Sales
Here is the entire data series for diesel prime supplier sales in the USA, courtesy of the EIA. This took a little bit to cobble together, as the changing sulfur regulations change the data series over time.
The data is reported monthly, in the form of the average daily sales of diesel, so if we see a value of 100,000 that is 100 million gallons per day in a particular month. I've plotted up the monthly values and the 12 month moving average which will smooth out the heavy seasonality we observe.
Tuesday, August 10, 2010
Structural Changes in the Labor Force?
So here is the labor force, in thousands of persons pulled from the St. Louis Fed FRED database by aggregating the eight regional data sets (non-seasonally adjusted). It pretty much grinds upwards at the rate of population growth, with some seasonality around the trend line...until recently.
As a fan of non-seasonally adjusted (NSA) data, one way to account for seasonal effects is to look at the data on a year over year basis, which we see above. The data series is right at twenty years, so it is not that long...but we see one striking observation with respect to changes in the size of the labor force on a year over year basis, there aren't any negative values until recently.
Now I have a quirk about trying to quantify things, but a meaningful framework of analysis is often the tricky bit (which is not to say that I have cracked that nut here!).
So, the approach I took was to compare the values for year over year change for the month of June across the data set, a total of twenty observations. I took the first nineteen to be from the same distribution, and assumed a normal distribution (quite arguable, but it keeps the spreadsheet work simple). Using the mean and standard deviation derived, if the last observation is from the same distribution, where does it fit?
For the June, 2010 year over year change in the labor force, the value is 4.5 standard deviations out which is, umm improbable...suggesting that this observation is from a different distribution, which I interpret as an indication of structural changes in the make up of the US labor force.
Examing the month over month change for the time series, a strong seasonality is clearly indicated. A comparison of June values only but for month over month changes might also be indicative...
So what does the month over month change tell us for June, 2010? Now we are only 3 standard deviations out, which is still <1%...
So, this would appear to be an armchair indication of structural changes in the labor force and hence reflected in the labor force participation rate, EMRATIO and the like.
Monday, August 2, 2010
State Tax Revenues - Q1 2010 Year Over Year Increase Due to Tax Rate Increases
OK, this has been out for a few weeks and there has been no direct discussion in the press that I have found that the year over year increases in state tax revenues for Q1 2010 are completely due to legislated tax increases (taking the Rockefeller estimates of the revenue impacts of those increases as a given).
Here is the table from the most recent report on state tax revenues by the Rockefeller Institute:
above from Rockefeller Institute State Revenue Report, July, 2010 p. 15
Now, let us normalize the reported increases in that table with the estimates of the impacts of legislated tax rate increases. First, the estimated impacts:
Now, the calculation of the impacts - taking the values for Personal Income Tax (PIT), Corporate Income Tax (CIT), Sales Tax and Total (which includes some other sources of revenue in addition to the three breakout categories):
Lots to think about here, but the most glaring question that arises is with respect to the retail revival that has been much reported in the business press...show me the money.
Rockefeller Institute State Revenue Report, July, 2010
Here is the table from the most recent report on state tax revenues by the Rockefeller Institute:
above from Rockefeller Institute State Revenue Report, July, 2010 p. 15
Now, let us normalize the reported increases in that table with the estimates of the impacts of legislated tax rate increases. First, the estimated impacts:
During the January-March 2010 quarter, enacted tax changes increased state revenue by an estimated net of $4.9 billion compared to the same period in 2009.3 Personal income tax increases accounted for approximately $2.7 billion and sales tax for approximately $1.7 billion of the change.
Rockefeller Institute State Revenue Report, July, 2010 pp. 12-13
Now, the calculation of the impacts - taking the values for Personal Income Tax (PIT), Corporate Income Tax (CIT), Sales Tax and Total (which includes some other sources of revenue in addition to the three breakout categories):
Lots to think about here, but the most glaring question that arises is with respect to the retail revival that has been much reported in the business press...show me the money.
Rockefeller Institute State Revenue Report, July, 2010
Friday, May 28, 2010
Deficit Spending - Percent of Federal Expenditures
Courtesy of St. Louis Fed FRED data update for 1Q2010, this plot uses two series of SAAR quarterly data: FGRECPT, which is federal government receipts and FGEXPND, which is federal government expenditures. I then calculate the percent of total federal expenditures that is borrowed ([FGRECPT-FGEXPND]/FGEXPND).
So, the question is what is the tipping point? Most analysis in the public domain seems centered around total debt as a function of GDP, and 100% as some kind of threshold...anyone see any papers using this framework?
Thursday, April 15, 2010
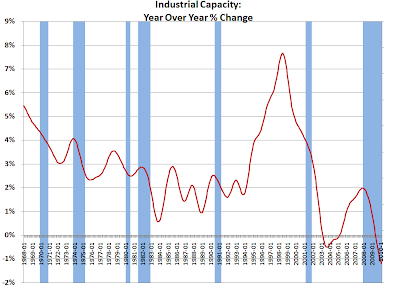
Industrial Capacity - More Record YoY Declines
Industrial capacity utilization rate was released today, along with industrial production. We continue to see record year over year declines in industrial capacity, now for the seventh consecutive month.
The headline year over year change in industrial capacity utilization was +3.7%, an about 25% of that increase is due to reducing the denominator, the decline in total industrial capacity. I decomposed the change by taking current industrial production and dividing it by the industrial capacity of a year ago to arrive at the +2.7%.
Wednesday, April 14, 2010
Retail Sales ex-Autos and State Sales Tax Receipts - correction (ht josap)
So here we are in the midst of a 'robust retail recovery', which unfortunately has yet to be manifested in the state sales tax receipts. Unfortunately, the most authoritative source of data there is provided quarterly and that at a modest lag...
So here we have a plot of the year over year change of 3 month moving average of retail sales ex-autos (RSFSXMV 3 mo MA) courtesy of the FRB FRED, and the year over year change in quarterly state sales tax receipts courtesy of the Rockefeller Institute of Government - if anyone can get the full time series of their data that would be great, but the current data set is limited to their most recent publication.
What the data set shows is the two curves as lines, and the faint green bars are the variance between the two. The average variance is -2.0% over the time period of the plot, and the most recent observation for 4Q2009 is -2.1%. Of interest is a quarterly breakout of the impacts of tax rate increases on total sales tax revenues, please post any information available in comments.
Technical notes: The RSFSXMV series is monthly, and a rolling 3 month cumulative total and the annual difference is calculated. The year over year change in quarterly state sales taxes are taken as is from the Rockefeller Institute, and then the monthly positions are a linear interpolation between those observations. The observed values were placed in the middle month of each quarter. [NB: Hat tip to josap who got me to re-examine my plot and so find a calculation bust!]
Monday, April 12, 2010
Personal Income and Transfer Receipts
Here is an update and refinement of the look at personal income less transfer receipts from the BEA NIPA Table 2.1.
A few observations:
1. On the way up, the personal income gains occurred primarily at the upper income ranges (some might say in a disproportionate manner).
2. On the way down, the personal income losses are falling most heavily on the lower income ranges (op cit).
3. 4Q2009 does not look like 'recovery' to me. We should see some slower rates of decline in 1Q2010, but that will be the first year on year comparison to the 1Q2009, the start of the 'cliff dive.'
The question occurred to me, what is the proportion of the transfer receipts to the personal income less transfer receipts? This seems pertinent to me as 98.5% of the transfer receipts are government social benefit payments to persons...
Friday, April 9, 2010
Marketable Treasury Debt Maturity - 1Q2010 Update
Looking at the debt held by the public, the front two quarters of Treasury roll has ballooned back up to just a hair under where it was this time a year ago. Over the quarter just passed, the marketable debt increased by 6.7%, which annualizes at ~29% rate of increase. This is also improvement from this quarter a year ago, when the quarterly rate of increase annualized at ~37%!
The actual increase on a year over year basis was $1.49 trillion of publicly held marketable debt, or a 23.9% increase. Again, my focus is just on the publicly held portion.
4Q2009 Update
3Q2009 Update
2Q2009 Update
1Q2009 Update
4Q2008
Data Source: Treasury Direct March 2010 MSPD
Wednesday, April 7, 2010
Charge Off and Delinquency Rates
In the previous two recessions that the time series covers, it appears the combined delinquency and charge off rates peaked within one quarter after the end of the recession.
The line plot is stacked, so the current combined rate in excess of 10% is the sum of the 3.04% charge off rate and the 7.42% delinquency rate (likewise for the year over year changes).
This might also serve as a supporting argument for why the unemployment rate (and underemployment rate) are now leading indicators...as they will be the primary driver for cure vs write off for the delinquencies (absent the Fed assuming the balance sheet of the entire private sector).
Data Source:
FRB CHGDEL Data Download Page
Tuesday, April 6, 2010
Year Over Year Decline in LOANS - New Record
So here we have more Fed FRED data, also in release H.8, specifically LOANS: Total Loans and Leases at Commercial Banks.
The most current data at this time is from February, 2010 and we can observe a new record decline on percent year over year basis.
It appears that the year over year change typically reaches a local minima from one to six months after the end of a recession, though the early '90s recession breaks this pattern. If the end of the recession was July, 2009 than this should start turning up...well, last month but if not this month...well, if not next month...
Sunday, April 4, 2010
U-6 - U-3 Spread NSA - Update
The spread between the non-seasonally adjusted numbers for U-6 - U-3 set a new record in February, at 7.5%. The value for the spread in March is 7.3%.
I have been arguing for some time that the UE rates and persistence are not lagging indicators but rather harbingers...but more on a gut basis rather than with any quantitative arguments. So this is an initial foray in that direction.
The old saw about UE being a lagging indicator is fundamentally based on the idea that things are going to go along in "Business As Usual" (BAU) mode. The dramatic elevation of the spread between U-6 and U-3 indicate that significant structural changes in employment markets are afoot.
The quantitative argument rests on the assumption of a normally distributed spread around the mean value, which may be questionable but not unreasonable (particularly from a simplistic BAU framework).
If we restrict BAU as the period prior to the start of this recession, the spread has a mean of 3.64% and a standard deviation of 0.42% which means the probability of seeing the current spread of 7.3% would occur once each 6.2 x 10^16 observations (monthly), or once every 5.1 x 10^15 years or so...without getting into the significant issues of autocorrelation for this series (the previous month's observation has significant predictive value for the next month's observation).
If we take a more expansive view of BAU as including the perturbations of the current recession then we experience a mean of 4.08% with a standard deviation of 1.13%, which would put the probability of the current spread at once each 159 observations, or once every 13.2 years.
No doubt the econometric police will shower me with approbation for this exercise, however it seems like the most direct way to make a quantitative argument that there are profound structural changes underway in the labor market and prism of recent experience during the expansion of the FIRE segment of the economy is a poor guide for the future.
Friday, April 2, 2010
Industrial Capacity - Continuing Record Declines
So we have had lots of play for the increases in the rate of industrial capacity utilization, but no play at all regarding the state of industrial capacity.
Short version: industrial capacity is going away at a faster rate than at any other period in the historical time series - which starts in 1967, so 1968 in terms of measuring year over year changes (Fed unique identifier: G17/CAP/CAP.B50001.S).
This month is another record in two ways - for the sixth straight month in a row - both the month over month decline and the year over year decline is the largest on record.
Wednesday, March 17, 2010
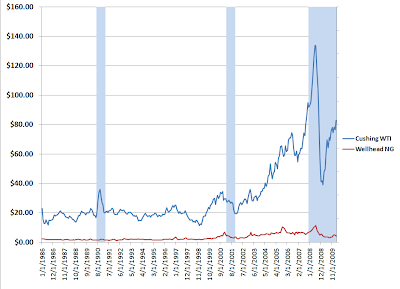
Oil to Natural Gas Price Ratio
Lots of discussion with a few members of the commentariat at Calculated Risk regarding the extreme nature of the price ratio between oil and natural gas so I decided to hunt up some data and see just what we were talking about.
The price behavior on a linear plot over the same time.
...and on a log plot due to the disparity of oil and gas when displayed on a common axis.
Data source:
EIA time series US Energy Information Administration
Wednesday, January 13, 2010
Federal Receipts - Federal Expenditures: 3Q2009 Update
Friday, January 8, 2010
Marketable Treasury Debt Maturity - Update
Well it looks like the boys and girls in the US Treasury have been busy pushing out the curve...the front quarter rollover was reduced by a whopping 20.8% while the front six months cumulative rollover dropped 5.5%. All this while the total marketable debt outstanding increased 3.4%...
Which begs the question, who is buying all the interest rate risk? The scuttlebutt I have read is that foreign holders are moving to shorter durations - anyone heard different with sources?
Data Source:US Treasury Dec 2009 MSPD
Previous post on rollover:Marketable Debt Rollover 3Q 2009
Friday, January 1, 2010
3rd Quarter State Sales & Gross Receipts Taxes
Well, the US Census Bureau released the data for state tax income, and I broke out the sales and gross receipts taxes to see how that showed aggregate economic activity performing.
On a year over year basis for the 3rd Qtr, state sales and gross receipts taxes were down -6.7%, and on a rolling 4 Qtr basis the year over year amount is down -7.6%.
While the 3rd Qtr is down from the 2nd Qtr, this is typically the case and the amount appears to be in the midrange of the -3% to -7% seen at -4.9%.
(If I get the chance I will update later with some additional data going back to 1988 - have to help my lovely wife pack for the trip home).
Data:
Quarterly Summary of State and Local Government Tax Revenue
Subscribe to:
Posts (Atom)