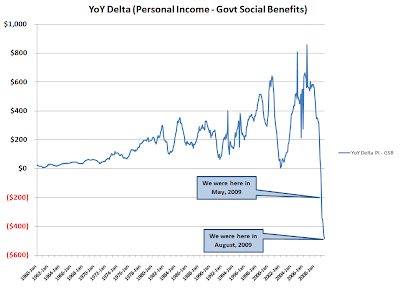
(NB: Y-axis is in billions of USD - hat tip RATM)
Well we had our 3.5% preliminary GDP number out this morning, so what is the sustainability of this "recovery?" Given how central consumption is to the economy, how has the personal income of my fellow citizens been doing - and not just the headline number, but what is personal income less government social benefit transfer payments?
Data from the latest BEA release, soon to be updated with September numbers (NIPA Table 2.1)
Download MS Excel Table with 2009 values
Link to previous post on topic
1 comment:
It probably wouldn't add too much other than point out that this number was relatively constant until ~2000, but you might consider converting to "real" dollars.
BTW - Informative and scary.
Post a Comment