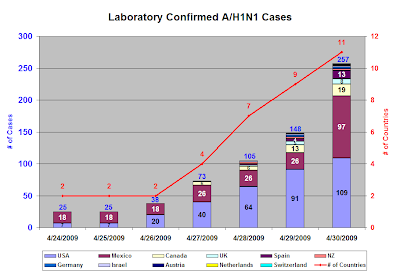
 According to WHO as of 1700 GMT 30 April 2009
http://www.who.int/csr/don/2009_04_30_a/en/index.html

The post showing the EOY 2008 maturity plot:
http://energyecon.blogspot.com/2009/01/treasury-marketable-debt-maturity.html

 OK the rate of change YoY for the 3 month MA of EMRATIO is officially into uncharted waters...plus an update on the CIVPART-EMRATIO spread.
  Well the discussion in CR on a reference to food stamp enrollment went the way I roll - what does the *data* show us - here without further ado is the year over year change in inidvidual food stamp enrollment for the very limited data set available on: