Wednesday, August 11, 2010

Diesel: US Prime Supplier Sales


Here is the entire data series for diesel prime supplier sales in the USA, courtesy of the EIA. This took a little bit to cobble together, as the changing sulfur regulations change the data series over time.

The data is reported monthly, in the form of the average daily sales of diesel, so if we see a value of 100,000 that is 100 million gallons per day in a particular month. I've plotted up the monthly values and the 12 month moving average which will smooth out the heavy seasonality we observe.

Tuesday, August 10, 2010

Structural Changes in the Labor Force?


So here is the labor force, in thousands of persons pulled from the St. Louis Fed FRED database by aggregating the eight regional data sets (non-seasonally adjusted). It pretty much grinds upwards at the rate of population growth, with some seasonality around the trend line...until recently.


As a fan of non-seasonally adjusted (NSA) data, one way to account for seasonal effects is to look at the data on a year over year basis, which we see above. The data series is right at twenty years, so it is not that long...but we see one striking observation with respect to changes in the size of the labor force on a year over year basis, there aren't any negative values until recently.


Now I have a quirk about trying to quantify things, but a meaningful framework of analysis is often the tricky bit (which is not to say that I have cracked that nut here!).

So, the approach I took was to compare the values for year over year change for the month of June across the data set, a total of twenty observations. I took the first nineteen to be from the same distribution, and assumed a normal distribution (quite arguable, but it keeps the spreadsheet work simple). Using the mean and standard deviation derived, if the last observation is from the same distribution, where does it fit?

For the June, 2010 year over year change in the labor force, the value is 4.5 standard deviations out which is, umm improbable...suggesting that this observation is from a different distribution, which I interpret as an indication of structural changes in the make up of the US labor force.


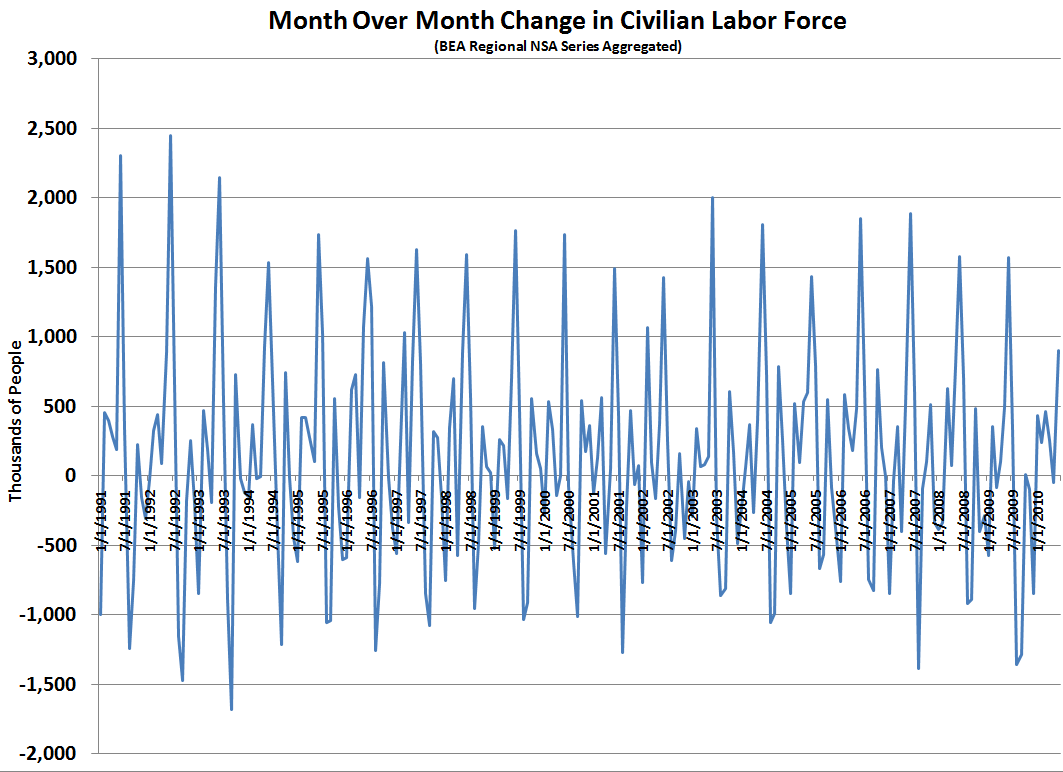
Examing the month over month change for the time series, a strong seasonality is clearly indicated. A comparison of June values only but for month over month changes might also be indicative...


So what does the month over month change tell us for June, 2010? Now we are only 3 standard deviations out, which is still <1%...

So, this would appear to be an armchair indication of structural changes in the labor force and hence reflected in the labor force participation rate, EMRATIO and the like.

Monday, August 2, 2010

State Tax Revenues - Q1 2010 Year Over Year Increase Due to Tax Rate Increases

OK, this has been out for a few weeks and there has been no direct discussion in the press that I have found that the year over year increases in state tax revenues for Q1 2010 are completely due to legislated tax increases (taking the Rockefeller estimates of the revenue impacts of those increases as a given).


Here is the table from the most recent report on state tax revenues by the Rockefeller Institute:


above from Rockefeller Institute State Revenue Report, July, 2010 p. 15


Now, let us normalize the reported increases in that table with the estimates of the impacts of legislated tax rate increases. First, the estimated impacts:
During the January-March 2010 quarter, enacted tax changes increased state revenue by an estimated net of $4.9 billion compared to the same period in 2009.3 Personal income tax increases accounted for approximately $2.7 billion and sales tax for approximately $1.7 billion of the change.

Rockefeller Institute State Revenue Report, July, 2010 pp. 12-13

Now, the calculation of the impacts - taking the values for Personal Income Tax (PIT), Corporate Income Tax (CIT), Sales Tax and Total (which includes some other sources of revenue in addition to the three breakout categories):


Lots to think about here, but the most glaring question that arises is with respect to the retail revival that has been much reported in the business press...show me the money.

Rockefeller Institute State Revenue Report, July, 2010

Friday, May 28, 2010

Deficit Spending - Percent of Federal Expenditures


Courtesy of St. Louis Fed FRED data update for 1Q2010, this plot uses two series of SAAR quarterly data: FGRECPT, which is federal government receipts and FGEXPND, which is federal government expenditures. I then calculate the percent of total federal expenditures that is borrowed ([FGRECPT-FGEXPND]/FGEXPND).

So, the question is what is the tipping point? Most analysis in the public domain seems centered around total debt as a function of GDP, and 100% as some kind of threshold...anyone see any papers using this framework?

Thursday, April 15, 2010

Industrial Capacity - More Record YoY Declines


Industrial capacity utilization rate was released today, along with industrial production. We continue to see record year over year declines in industrial capacity, now for the seventh consecutive month.

The headline year over year change in industrial capacity utilization was +3.7%, an about 25% of that increase is due to reducing the denominator, the decline in total industrial capacity. I decomposed the change by taking current industrial production and dividing it by the industrial capacity of a year ago to arrive at the +2.7%.

Wednesday, April 14, 2010

Retail Sales ex-Autos and State Sales Tax Receipts - correction (ht josap)


So here we are in the midst of a 'robust retail recovery', which unfortunately has yet to be manifested in the state sales tax receipts. Unfortunately, the most authoritative source of data there is provided quarterly and that at a modest lag...

So here we have a plot of the year over year change of 3 month moving average of retail sales ex-autos (RSFSXMV 3 mo MA) courtesy of the FRB FRED, and the year over year change in quarterly state sales tax receipts courtesy of the Rockefeller Institute of Government - if anyone can get the full time series of their data that would be great, but the current data set is limited to their most recent publication.

What the data set shows is the two curves as lines, and the faint green bars are the variance between the two. The average variance is -2.0% over the time period of the plot, and the most recent observation for 4Q2009 is -2.1%. Of interest is a quarterly breakout of the impacts of tax rate increases on total sales tax revenues, please post any information available in comments.

Technical notes: The RSFSXMV series is monthly, and a rolling 3 month cumulative total and the annual difference is calculated. The year over year change in quarterly state sales taxes are taken as is from the Rockefeller Institute, and then the monthly positions are a linear interpolation between those observations. The observed values were placed in the middle month of each quarter. [NB: Hat tip to josap who got me to re-examine my plot and so find a calculation bust!]

Monday, April 12, 2010

Personal Income and Transfer Receipts


Here is an update and refinement of the look at personal income less transfer receipts from the BEA NIPA Table 2.1.

A few observations:
1. On the way up, the personal income gains occurred primarily at the upper income ranges (some might say in a disproportionate manner).
2. On the way down, the personal income losses are falling most heavily on the lower income ranges (op cit).
3. 4Q2009 does not look like 'recovery' to me. We should see some slower rates of decline in 1Q2010, but that will be the first year on year comparison to the 1Q2009, the start of the 'cliff dive.'


The question occurred to me, what is the proportion of the transfer receipts to the personal income less transfer receipts? This seems pertinent to me as 98.5% of the transfer receipts are government social benefit payments to persons...