Tuesday, September 28, 2010

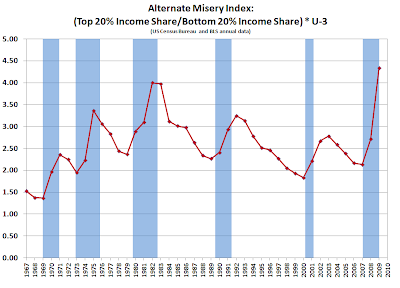
Alternate Misery Index


OK, so the commentariat over at Calculated Risk was kicking around conceps for an alternate misery index (or at least cinco-x and myself). If you will recall, the original misery index is the sum of the unemployment rate and the rate of inflation (Okun).

But in ZIRP world, inflation is not much of a factor even though misery we got aplenty, so what might be another approach to quantifying that? Above is one alternative, taking annual data from BLS for U-3 unemployment (well, that was monthly data taking an annual arithmetic average) and Census data for the ratio of the income share of the top 20% to the income share of the bottom 20% for the USA.

I think the 2010 numbers will be pretty close to the current set, so a conjecture for 2010 would be an approximately level line segment from 2009... though the most striking thing to me was the rate of change 2008-2009, I think the ripples are still propagating across the pond on that.

Friday, September 17, 2010

Household Formation and USA Population Changes


I'm still trying to figure out if this is just a descriptive statistics exercise or whether it may also inform on another level, but this is taking Census data for the number of households and the total population of the USA and looking at the ratio of the annual change in the number of households over the annual change in the population.

It is interesting to note that in some years, the number of households added exceeded the number of people added, so there are multiple factors in play... perhaps the most significant of which was the coming of age of boomer cohort members (with respect to the household formation rate). Any thoughts appreciated.

Friday, September 3, 2010

Decline in UEMPMED - Labor Market Deterioration?

So we saw a sharp decline in the median duration of unemployment with today's data release from the St. Louis Fed FRED database (mad propz to FRED!). Is this really an indication of improvements in the labor market in the USA?

Here we have the data series from FRED for the unemployed, segmented by duration. It is a bit busy, so what we are looking at here is the proportion of the 100% of the unemployed that each duration segment is contributing to that total...with the absolute number of each segment as the label for each month as well.

With respect to the longest term unemployed data segment, 27 Weeks and Over, is declining in both the absolute number and the relative contribution. On a month over month basis, the trend is also solidly in decline. But is the reason for this decline improvements in the labor market or workers exiting the labor force?

Looking at the change in PAYEMS, the total non-farm payroll in thousands of employees, the answer appears to be exit...


And finally, as a lagniappe for a negative interpretaion of the decline in UEMPMED, it appears that there was a big jump in the in the unemployed between 1-3 months, UEMP5TO14.


To recap on reasons for the decline in UEMPMED:
1. The longest term unemployed are declining according to the current counting methodology
2. They are almost certainly exiting the labor force as non-farm payrolls are flat over the period of the big declines in UEMPMED
3. A significant increase in the UE duration segment of between 1-3 months is also pulling the median down