Saturday, April 4, 2009
Thursday, April 2, 2009
Fast Food Stamps for Scone
http://www.fns.usda.gov/pd/34SNAPmonthly.htm
Saturday, March 28, 2009
EMRATIO - More Back to the Future
There I was, blissing on the latest chart and info posted on Calculated Risk, and the point was made by the commentariat (ht Evil Henry Paulson IIRC) that EMRATIO was the real tell regarding the state of the economy in the US...so I had to update my CIVPART-EMRATIO spread chart, which shows continued widening.
But then I got to thinking about the change in EMRATIO, so I smoothed things a bit by making a 3 Month Moving Average, and then took the Year Over Year change in that to generate the second plot. For rate of change, this recession is in there with the best of them and out does the double dip of the 80's - what it does not have (so far) is duration...
Saturday, March 14, 2009
Port of Los Angeles TEU Volumes Year Over Year
Over at Calculated Risk yesterday there was a post on the TEU traffic at the Port of Los Angeles, with lots o' discussion on what was going on. I prefer the Year Over Year view of this sort of data, which accounts for seasonal variability in the month to month changes. This plot is the rate of change for the YoY (3 month MA), so the absolute level of TEU volumes is still climbing if the plot is above 0%. Below 0%, there is an absolute decline in YoY TEU volumes, though the MoM number could still be up (just lower than the same month in the previous year)
- Total (In + Out) TEU volumes began declining in absolute terms prior to the start of the recession, have been doing so continuously since that start, and recently began moving sharply downward
- There was a period of flat to mild decline in YoY TEU volumes in 4Q2004 to 3Q2005
- In the last recession (2001), while the rate of growth significantly declined, it did not go negative (3 month MA of TEU volumes)
The Calculated Risk post:
http://www.calculatedriskblog.com/2009/03/la-port-import-traffic-collapses-in.html
Saturday, March 7, 2009
U-6's Disturbing Seasonal Trend
U-6 non-seasonally adjusted has become my weathervane for employment distress, and there are two disturbing trends (in addition to the value being too damn high at 16%!):
- The rate of change reaccelerated (the second derivative increased) - we need to see that start to come down or at least stabilize for that light in the tunnel be daylight and not train.
- The seasonal trend should be for the absolute value to decline going into the first quarter, but it is not - it is increasing - not good.
This is what I am talking about - unfortunately, the time series is somewhat limited for U-6 - but as you can see, even through the last recession the seasonal pattern of a Month Over Month decline held. Things are different this time.
Saturday, February 21, 2009
U-6 Year Over Year Delta of the Delta: Acceleration Slowing?
Context: this is the rate of change of the Year Over Year change in U-6 (unadjusted). The absolute number may go down from one monthe to the next but still represent an increase from the previous year...this approach avoids the seasonality issues but can be more than a little confusing when you start looking at the underlying time series. We may be seeing some flattening in the acceleration, which would be slightly encouraging in that the breathtaking rate of increase might at least subside. However, in the last recession the YoY U-6 continued to increase for another two years after that point (albeit, much more slowly). Here we are starting from a higher base rate for U-6 in absolute terms, ramping up much faster and will likely take longer to begin the reduction when that happy day finally arrives.
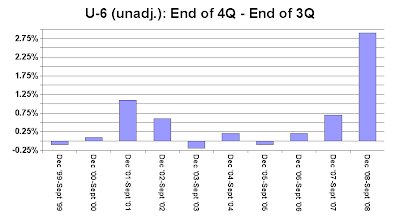
In the "it is different this time" department, I wondered how the end of year changes looked for the U-6 (unadj.) time series - how was the end of year holiday hiring? This graph looks at the change in U-6 (Dec 'XX - Sept 'XX) from 1999 to 2008. Grim.
U-6 - U-3 Spread Revisited
Subscribe to:
Posts (Atom)